Análisis de datos
Contents
Análisis de datos#
Se importan las librerías
import pandas as pd
a) se leen los datos al dataframe
res = pd.read_csv('DatosSeguros.csv')
res.head(3)
| edad | sexo | imc | hijos | fumador | region | valor_seguro | |
|---|---|---|---|---|---|---|---|
| 0 | 19 | F | 27.9 | 0 | yes | Caribe | 16884.924 |
| 1 | 19 | F | 27.9 | 0 | yes | Caribe | 16884.924 |
| 2 | 19 | F | 27.9 | 0 | yes | Caribe | 16884.924 |
Descripción de los datos
res.describe()
| edad | imc | hijos | valor_seguro | |
|---|---|---|---|---|
| count | 1349.000000 | 1347.000000 | 1349.000000 | 1349.000000 |
| mean | 39.109711 | 30.618682 | 1.092661 | 13311.523280 |
| std | 14.071136 | 6.120026 | 1.205027 | 12135.346316 |
| min | 18.000000 | 15.960000 | 0.000000 | 1121.873900 |
| 25% | 26.000000 | 26.220000 | 0.000000 | 4751.070000 |
| 50% | 39.000000 | 30.300000 | 1.000000 | 9411.005000 |
| 75% | 51.000000 | 34.600000 | 2.000000 | 16884.924000 |
| max | 64.000000 | 53.130000 | 5.000000 | 63770.428010 |
res.count()
edad            1349
sexo            1349
imc             1347
hijos           1349
fumador         1347
region          1349
valor_seguro    1349
dtype: int64
importar librebrias para graficar#
import matplotlib.pyplot as plt
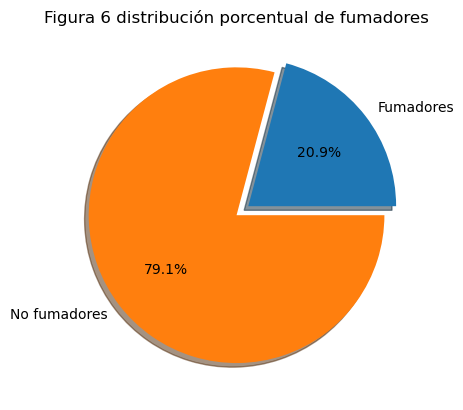
a) comparación entre el total de fumadores contra los que pagan mas por el valor del seguro
# personas que fuman
cuenta_fumadores = res[res['fumador'] == 'yes'];
fuma = cuenta_fumadores['fumador'].count();
# cantidad de personas que no fuman
nofuma = res[res['fumador'] != 'yes']['fumador'].count();
print(f'fumadores: {fuma}, No fumadores: {nofuma}')
fumadores: 281, No fumadores: 1066
plt.pie(x=[fuma, nofuma], labels=['Fumadores','No fumadores'],  autopct='%1.1f%%',\
        explode=[0.1, 0], shadow=True);
plt.title('Figura 6 distribución porcentual de fumadores');
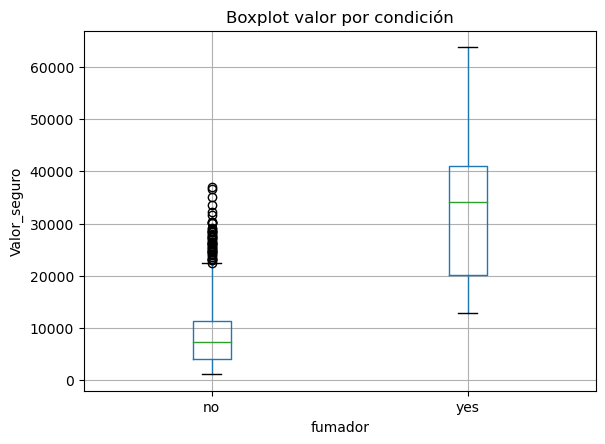
Gaficar un bloxplot donde se muestre el valor del seguro agrupado por fumadores
fig = res.boxplot("valor_seguro", by="fumador");
plt.ylabel('Valor_seguro');
plt.suptitle('');
plt.title('Boxplot valor por condición');
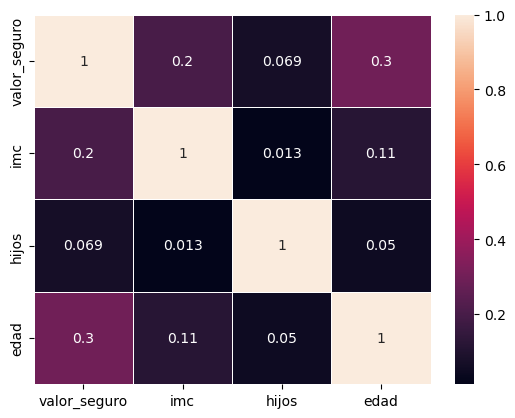
Generando el heatmap#
import seaborn as sns
dt = res[['valor_seguro','imc','hijos','edad']]
Compute pairwise correlation of columns
corr = dt.corr()
sns.heatmap(corr, linewidths=0.5, annot=True);
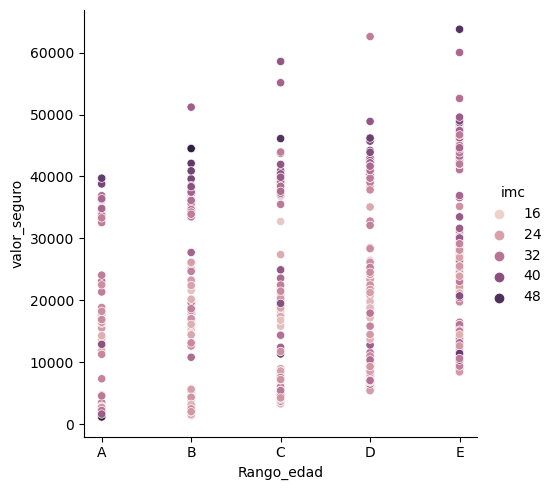
Se busca agrupar los datos por rango de edades#
Hay que crear una columna nueva calculada#
dt2 = res
dt2['Rango_edad'] = dt2.apply(lambda row: [[[['E','D'][row.edad < 50], 'C'][row.edad < 40], 'B'][row.edad < 30], 'A'][row.edad < 20], axis = 1)
fig = sns.relplot(x='Rango_edad' ,y='valor_seguro',hue='imc',data=dt2)
# fig.set_titles('Figura 11. Relación tres variables: valor seguro, rango de edad y el índice de masa corporal')
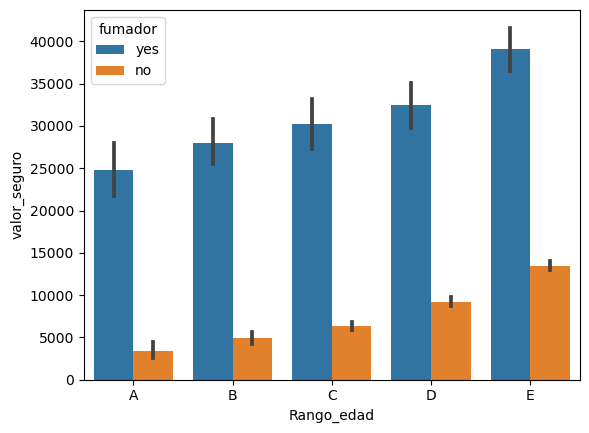
sns.barplot(data=dt2,x='Rango_edad',y='valor_seguro', hue='fumador');
